User Guide
Work zone introduction
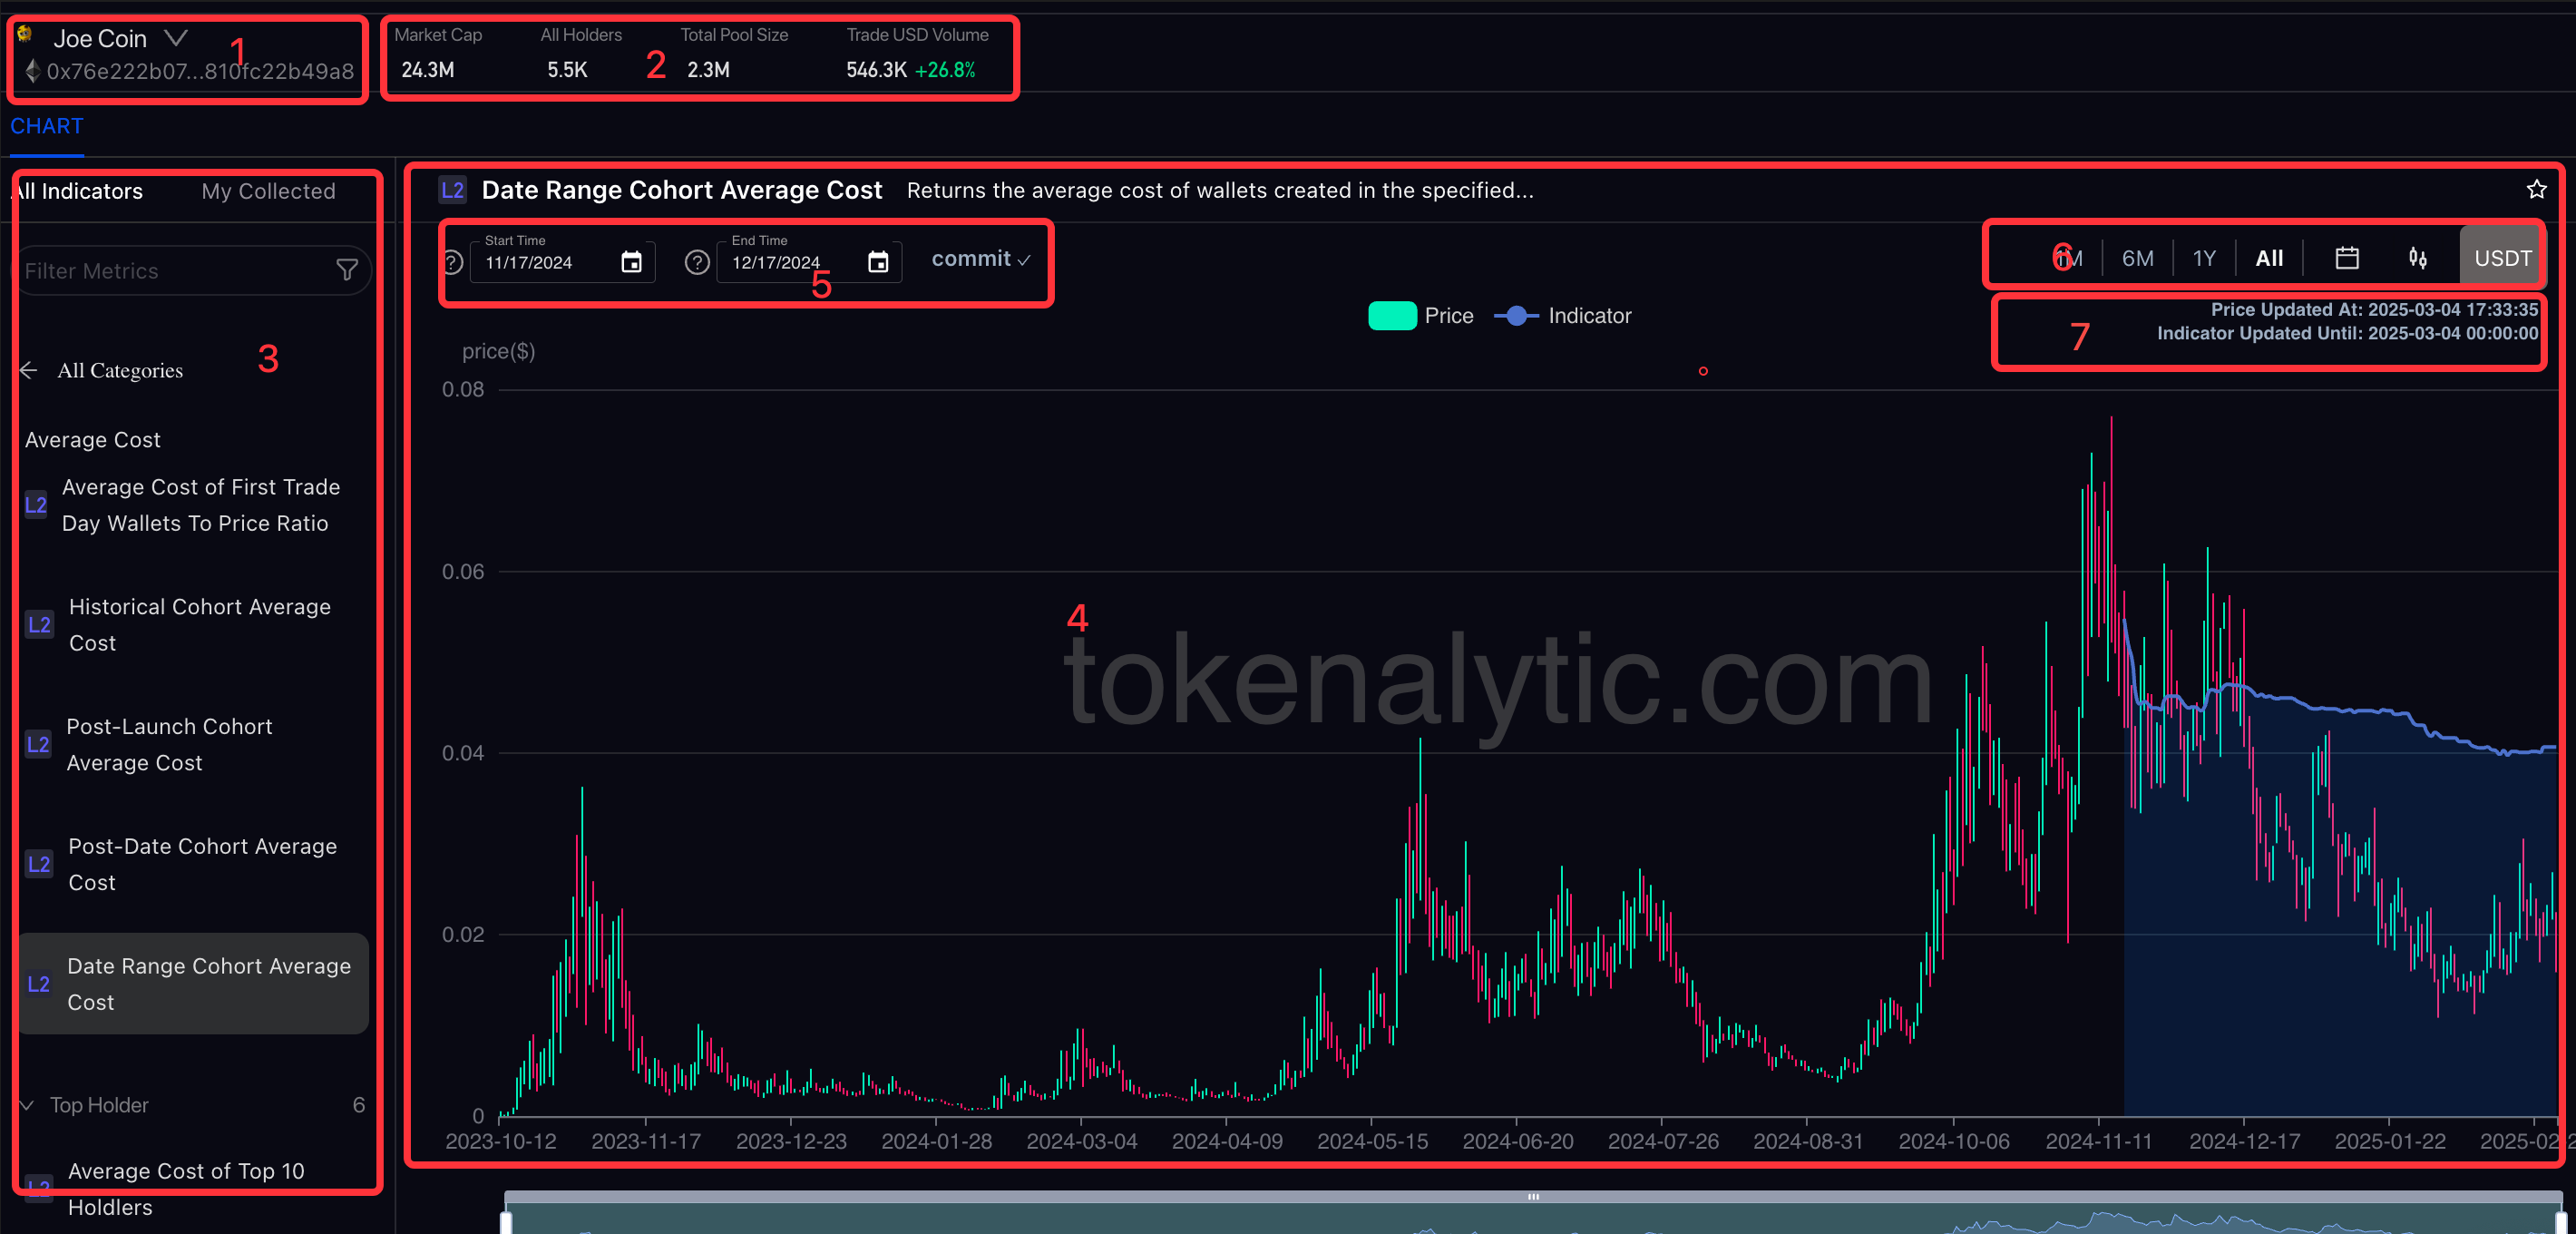
- zone-1: Token search and select
- zone-2: Token basic info display
- zone-3: Indicator select area
- zone-4: Main chart display
- zone-5: Indicator Param setting and commit
- zone-6: K-line time range select
- zone-7: Indicator update info
Token search and select
This is where you can search for tokens based on keywords or contract addresses.
Indicator Param setting
Tokenalytic has a built-in engine that calculates indicators dynamically, enabling you to dive deeply into an indicator's behavior. For example, you can inspect how an indicator's trends change throughout the entire historical timeline.
Example-1 Threshold Params
For some indicators, you can set a threshold. For example, if you want to know the balance ratio of the top N holders (N=110): 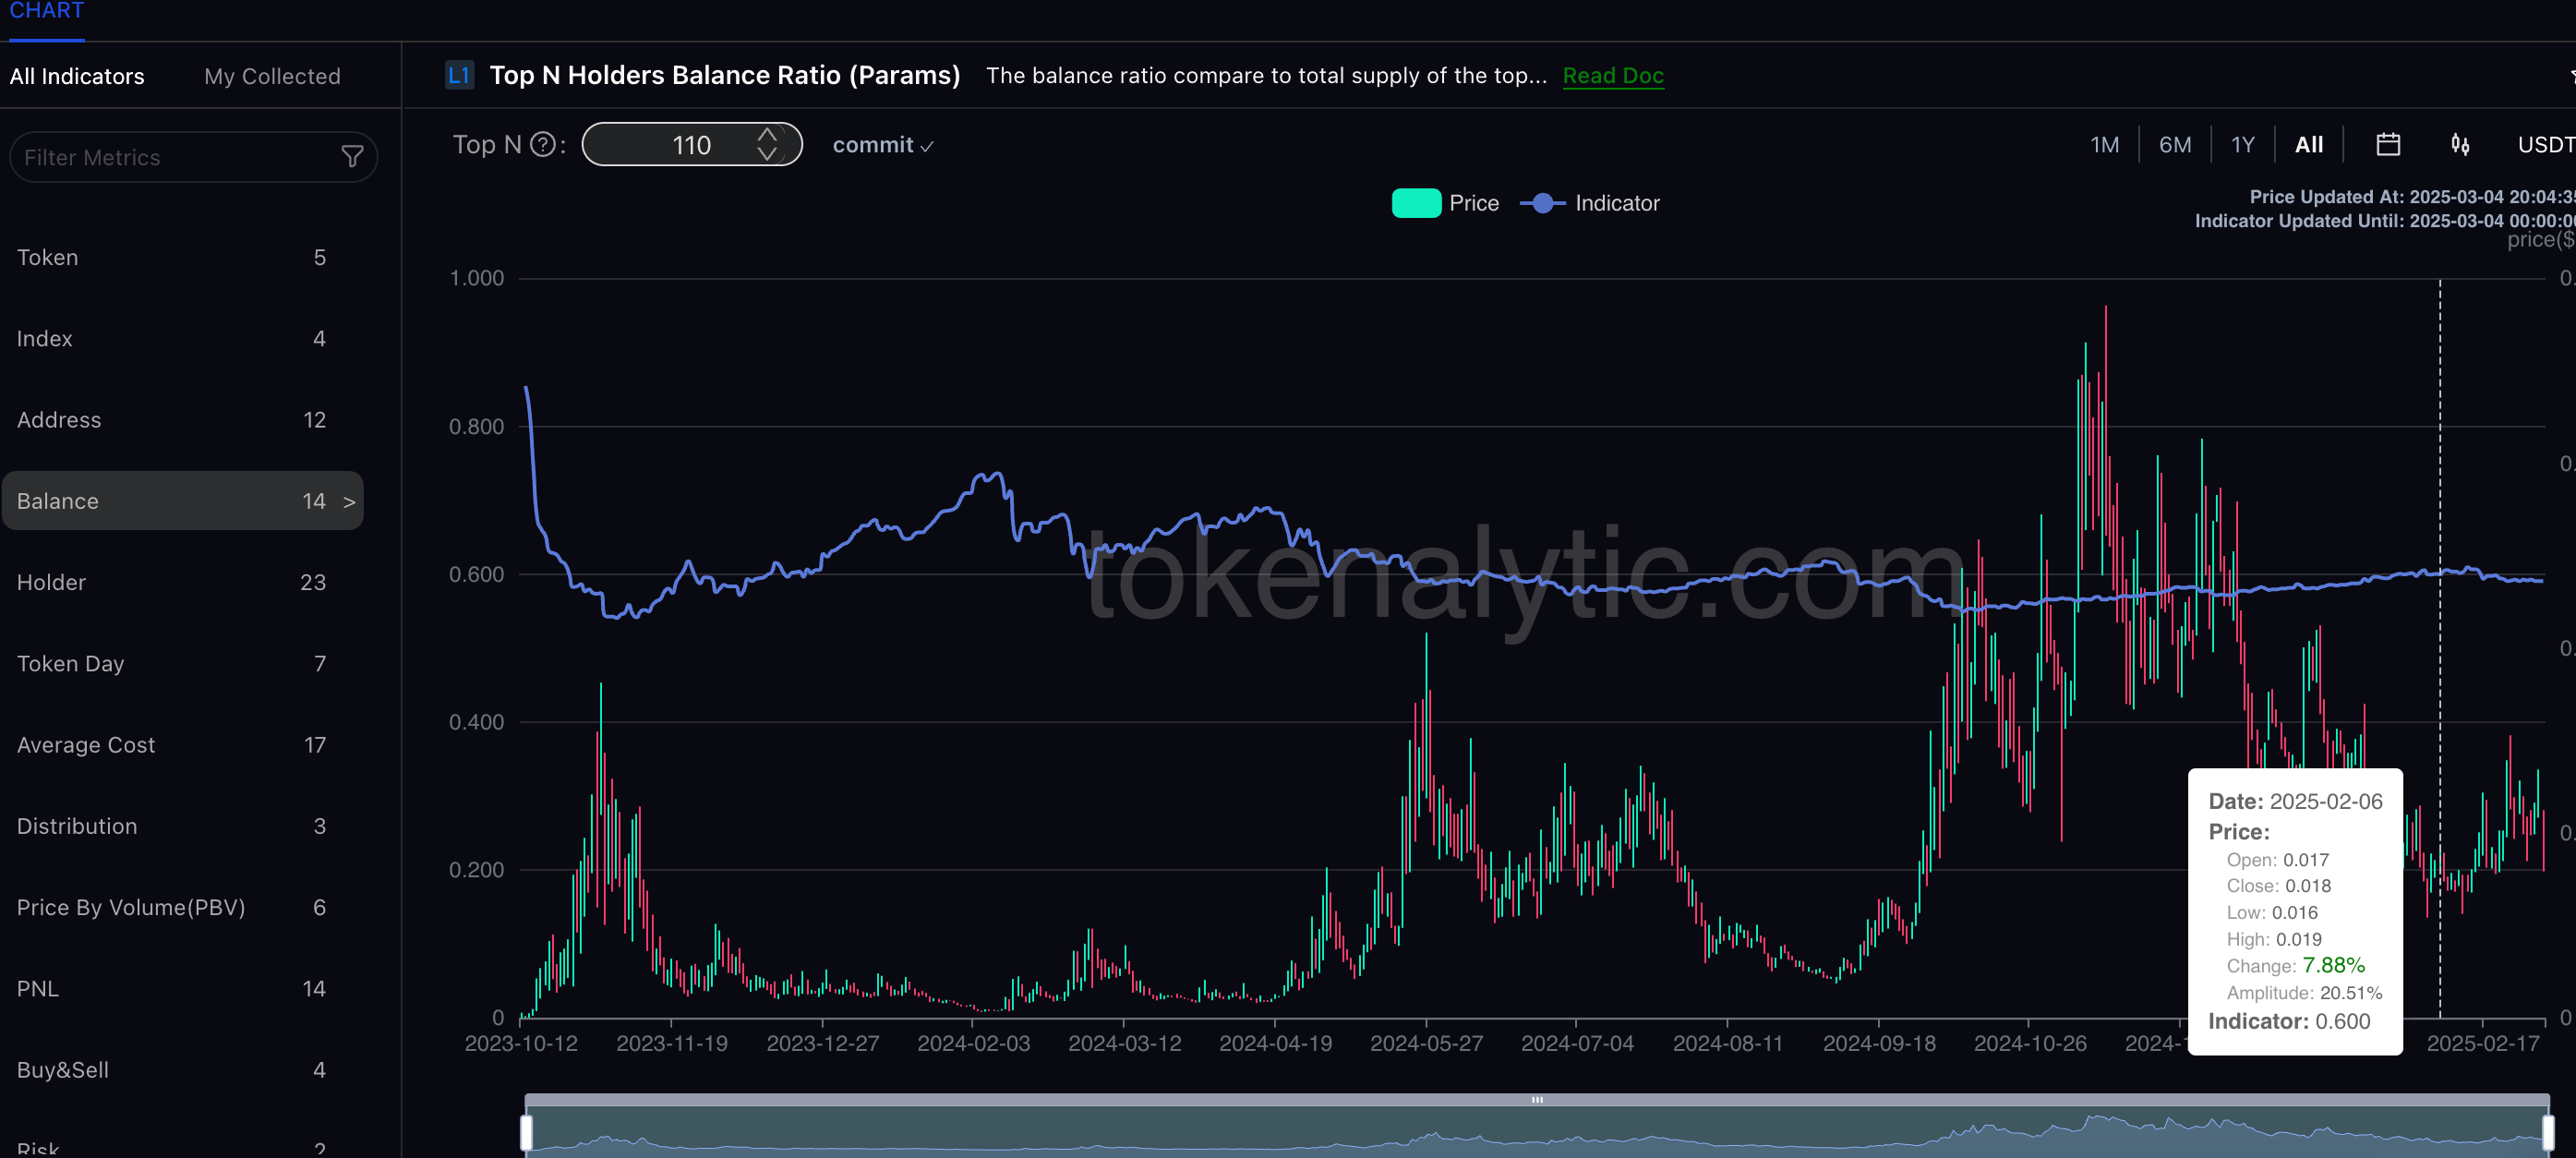
Example-2 Time Range Params
Let's take 'Date Range Cohort Average Cost' as an example. You can easily select the time range of 2023-12-15 to 2024-04-19 to get the indicator's value line. For this specific indicator, it will display the average cost of wallets created between these dates for the $JOE token. For this example, this timeframe was selected because it represents a long period of low price, suggesting significant token accumulation.
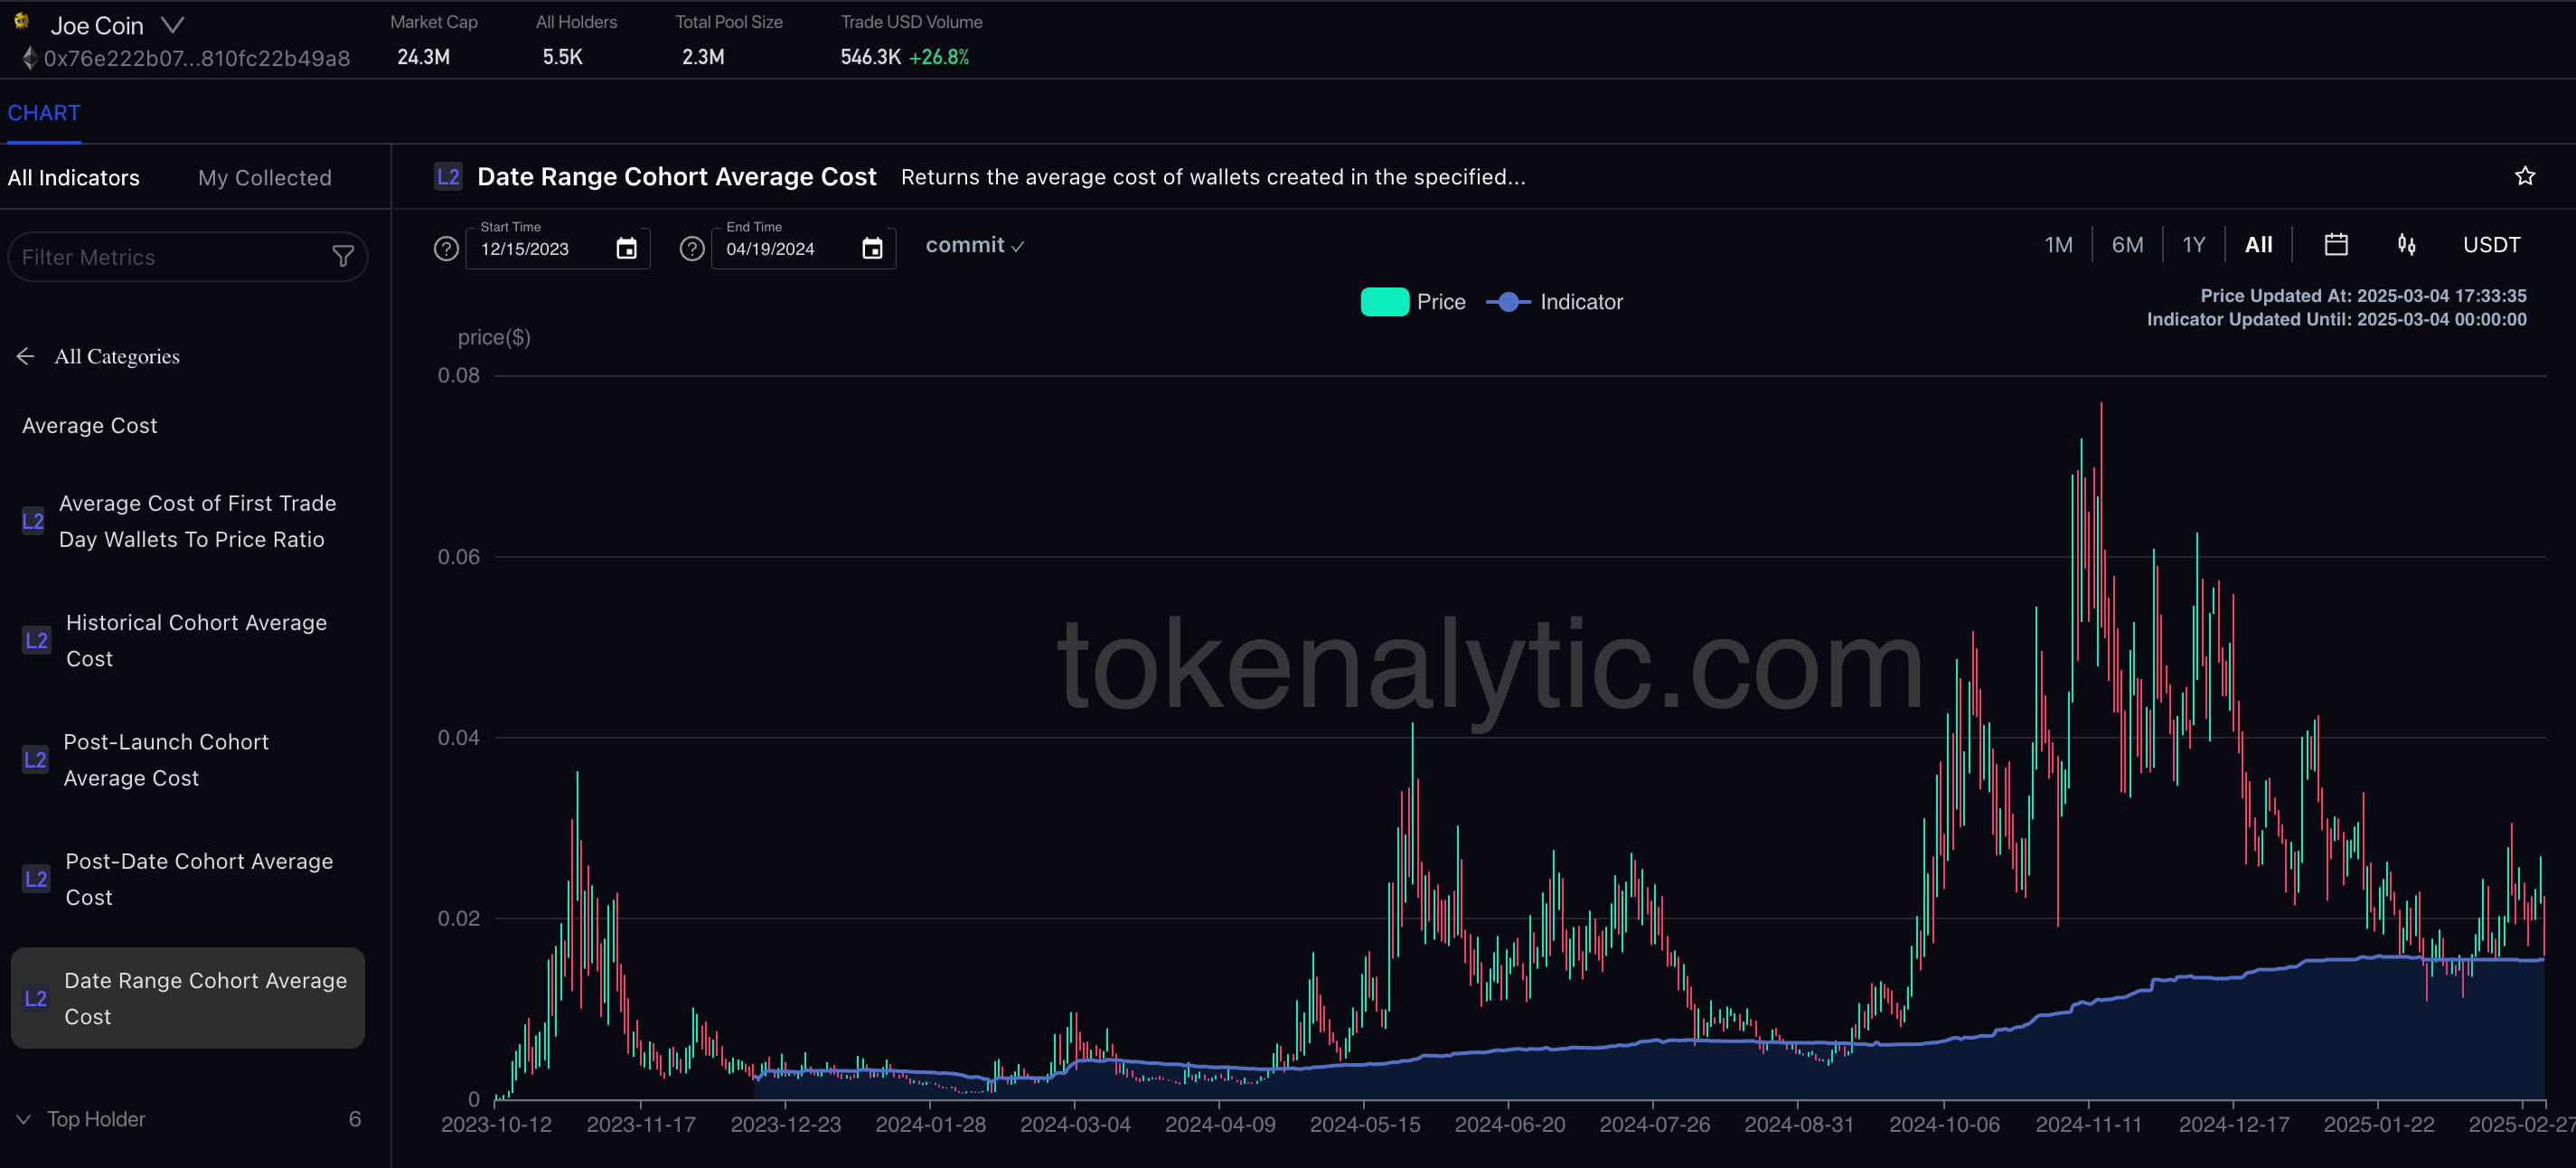
You can also check these wallets' token balance ratio trend using "Date Range Cohort Wallets Balance Ratio" under the 'Balance' category to discover how many tokens these wallets are holding. 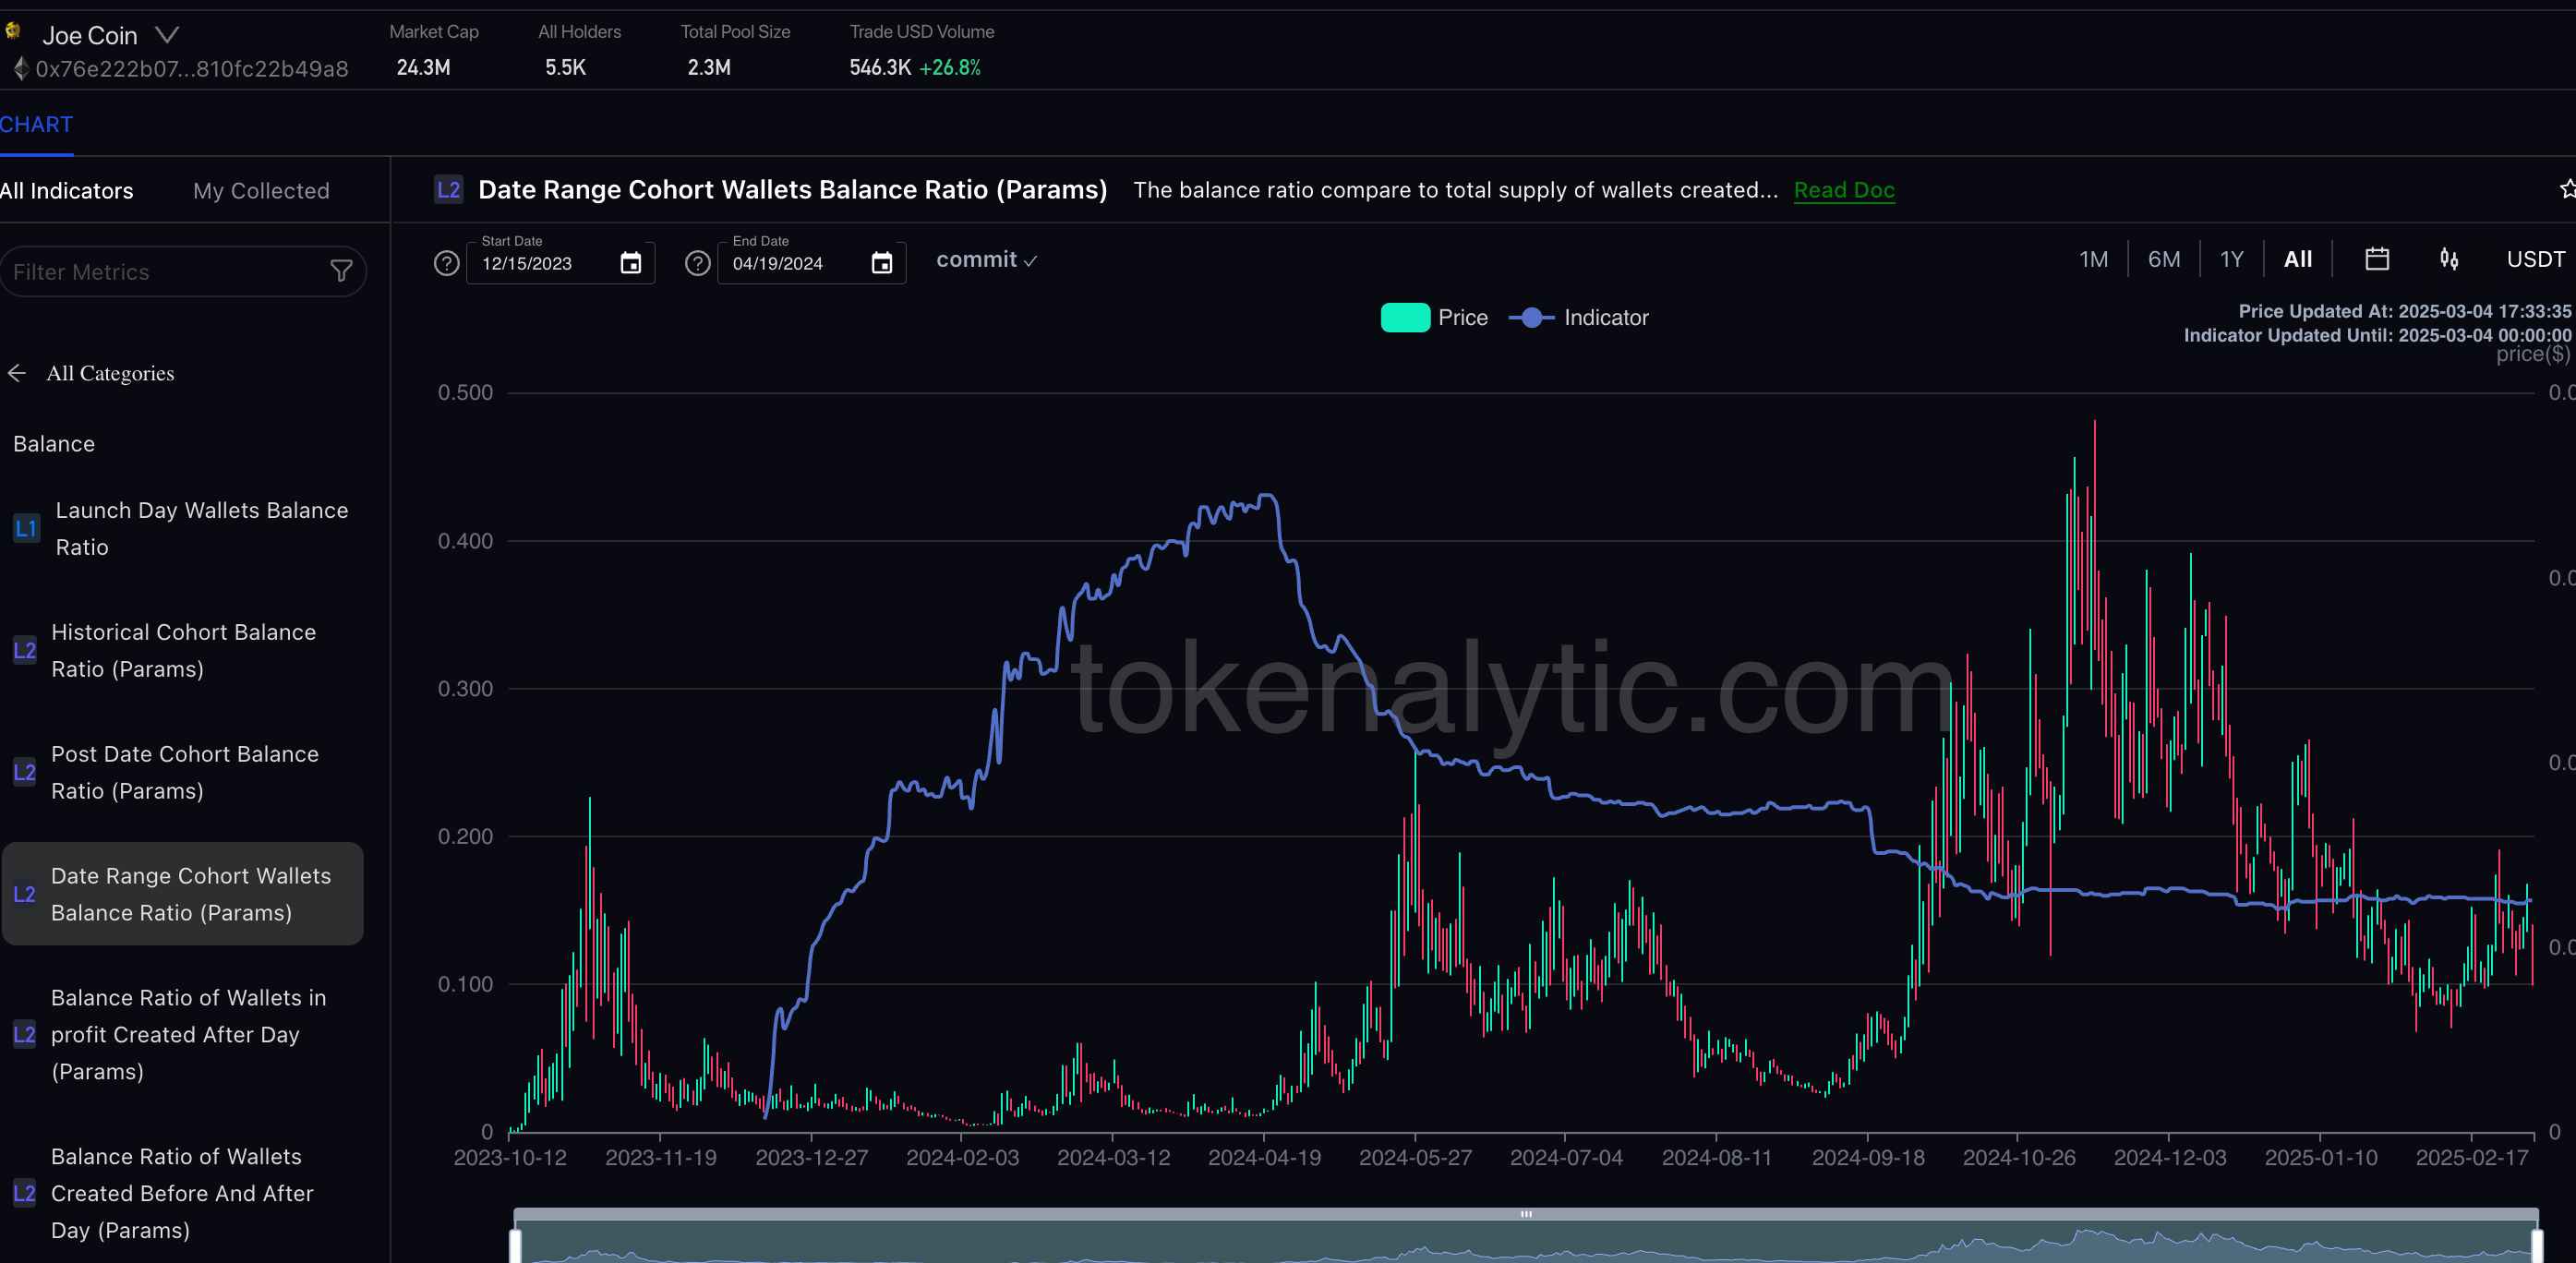
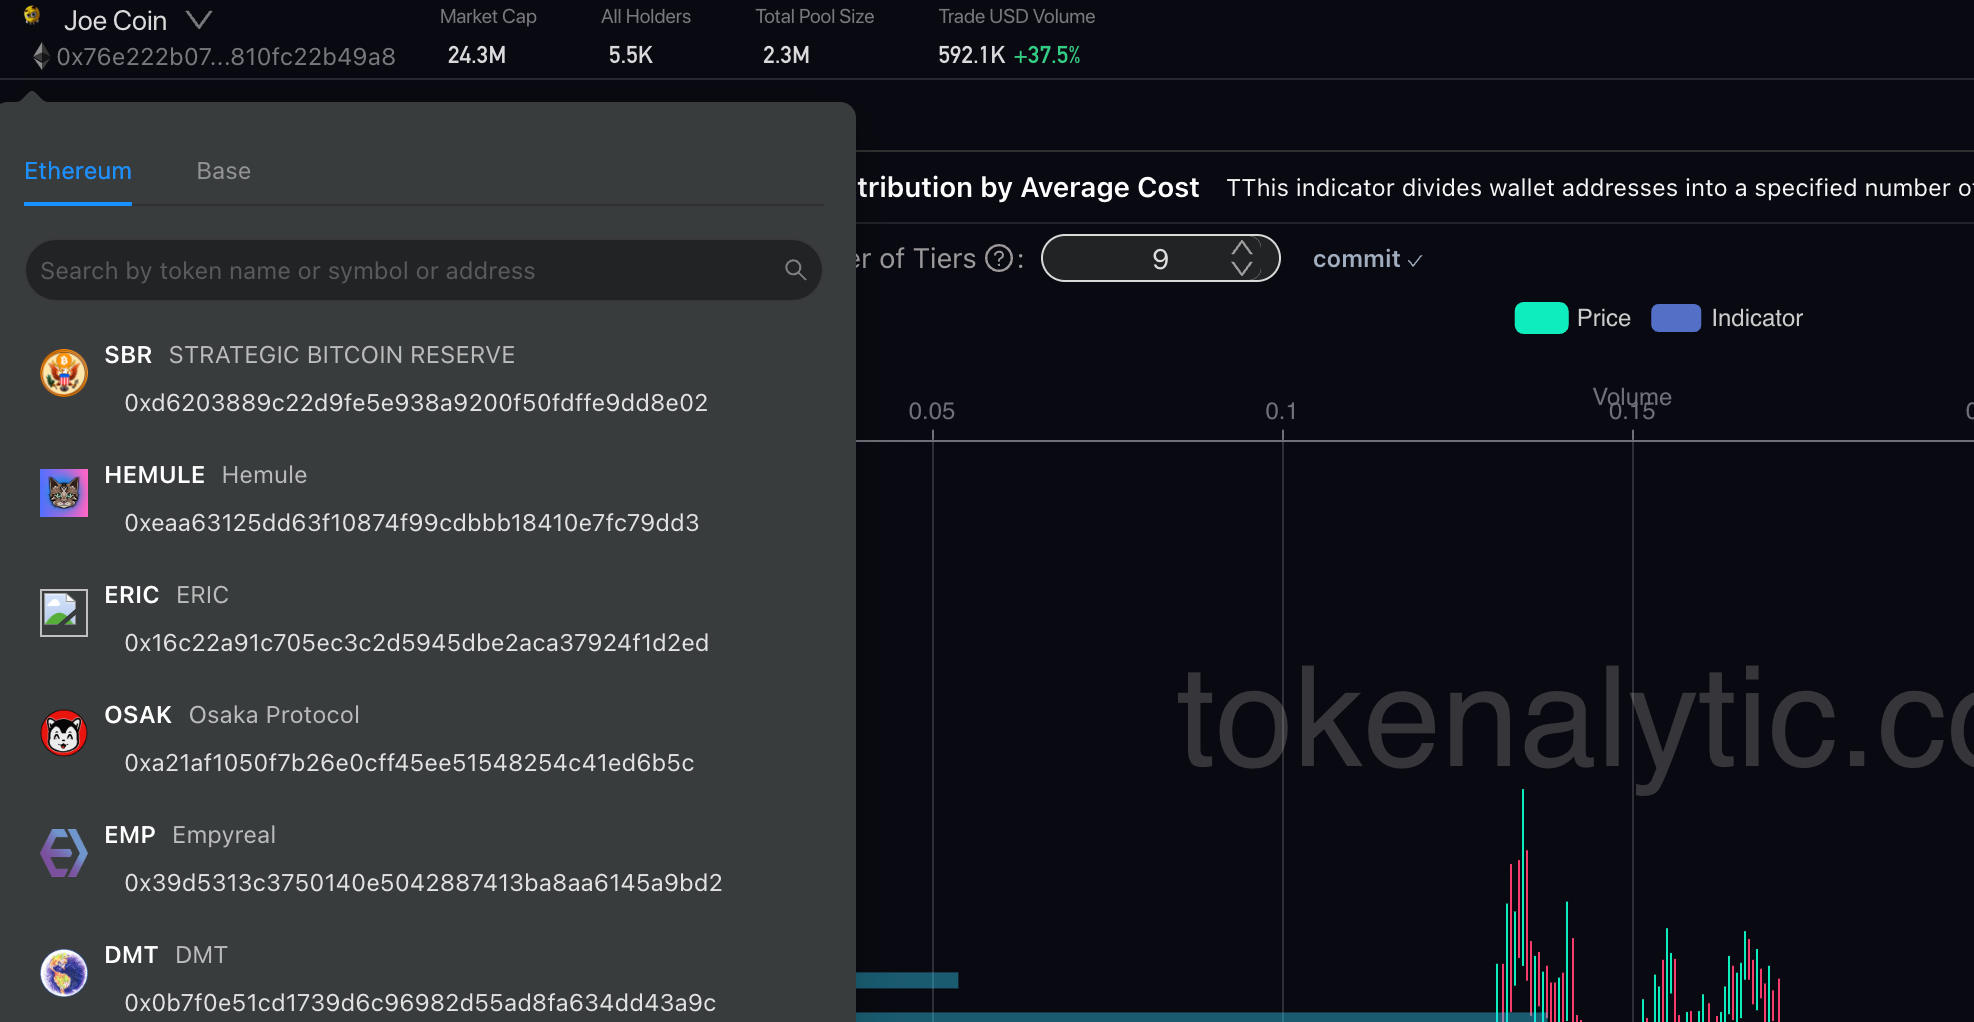
Example-3 Multi Params
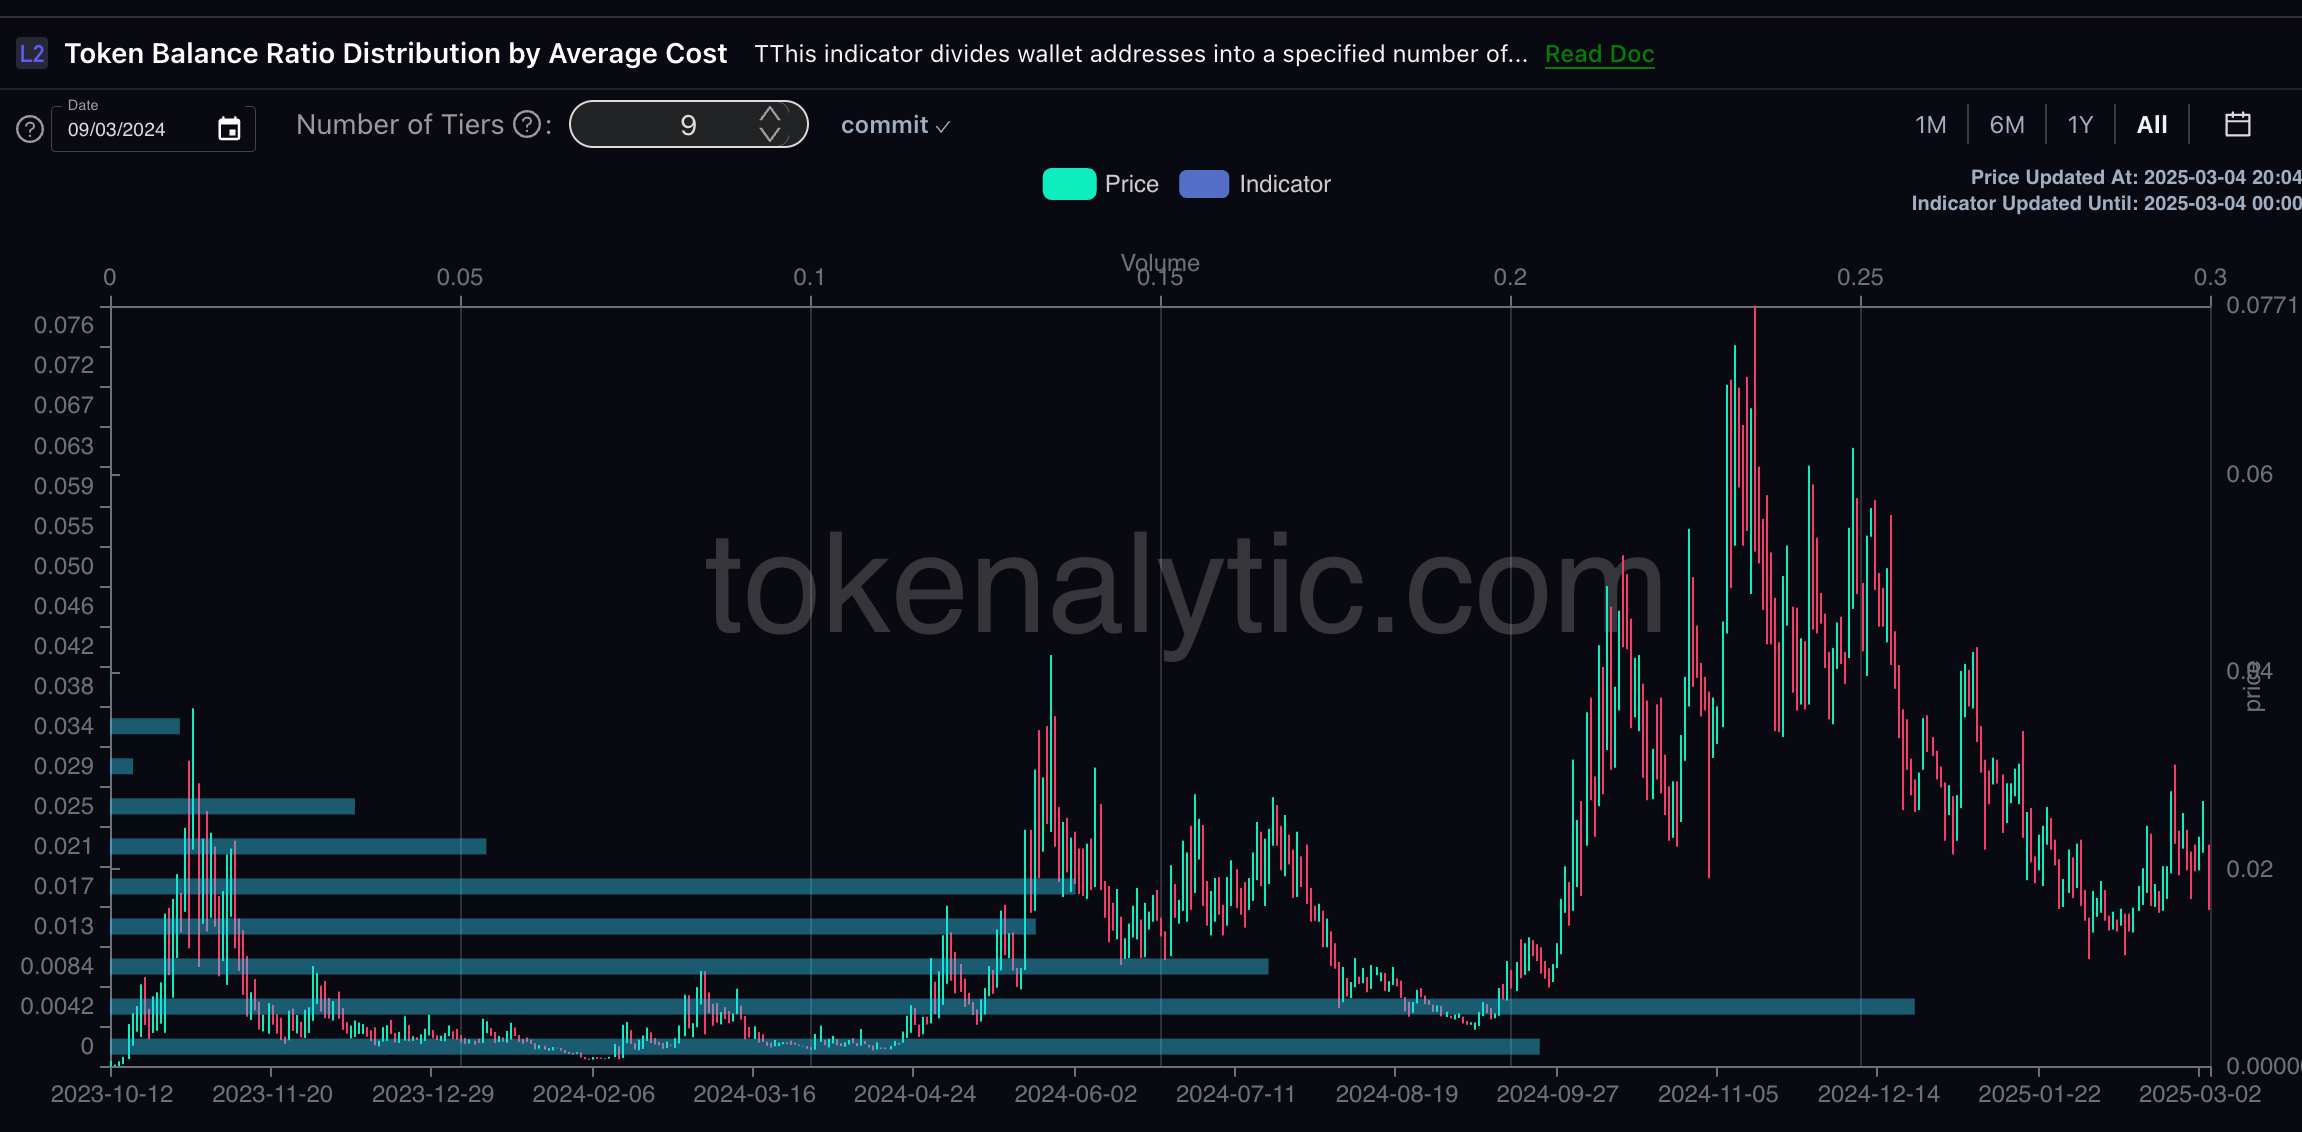
This example 'Token Balance Ratio Distribution by Average Cost' demonstrates a more complex parameter setting, though it's still easy to understand. When you select this indicator, it shows how the token's average cost is distributed. The time parameter lets you select which checkpoint you want to analyze. As time progresses and trading occurs, this distribution naturally changes. The "Number of Tiers" parameter determines how many divisions the cost basis spectrum will be split into (e.g., 33 creates 33 distinct cost-based tiers). Different tier levels provide varying levels of precision in the distribution. 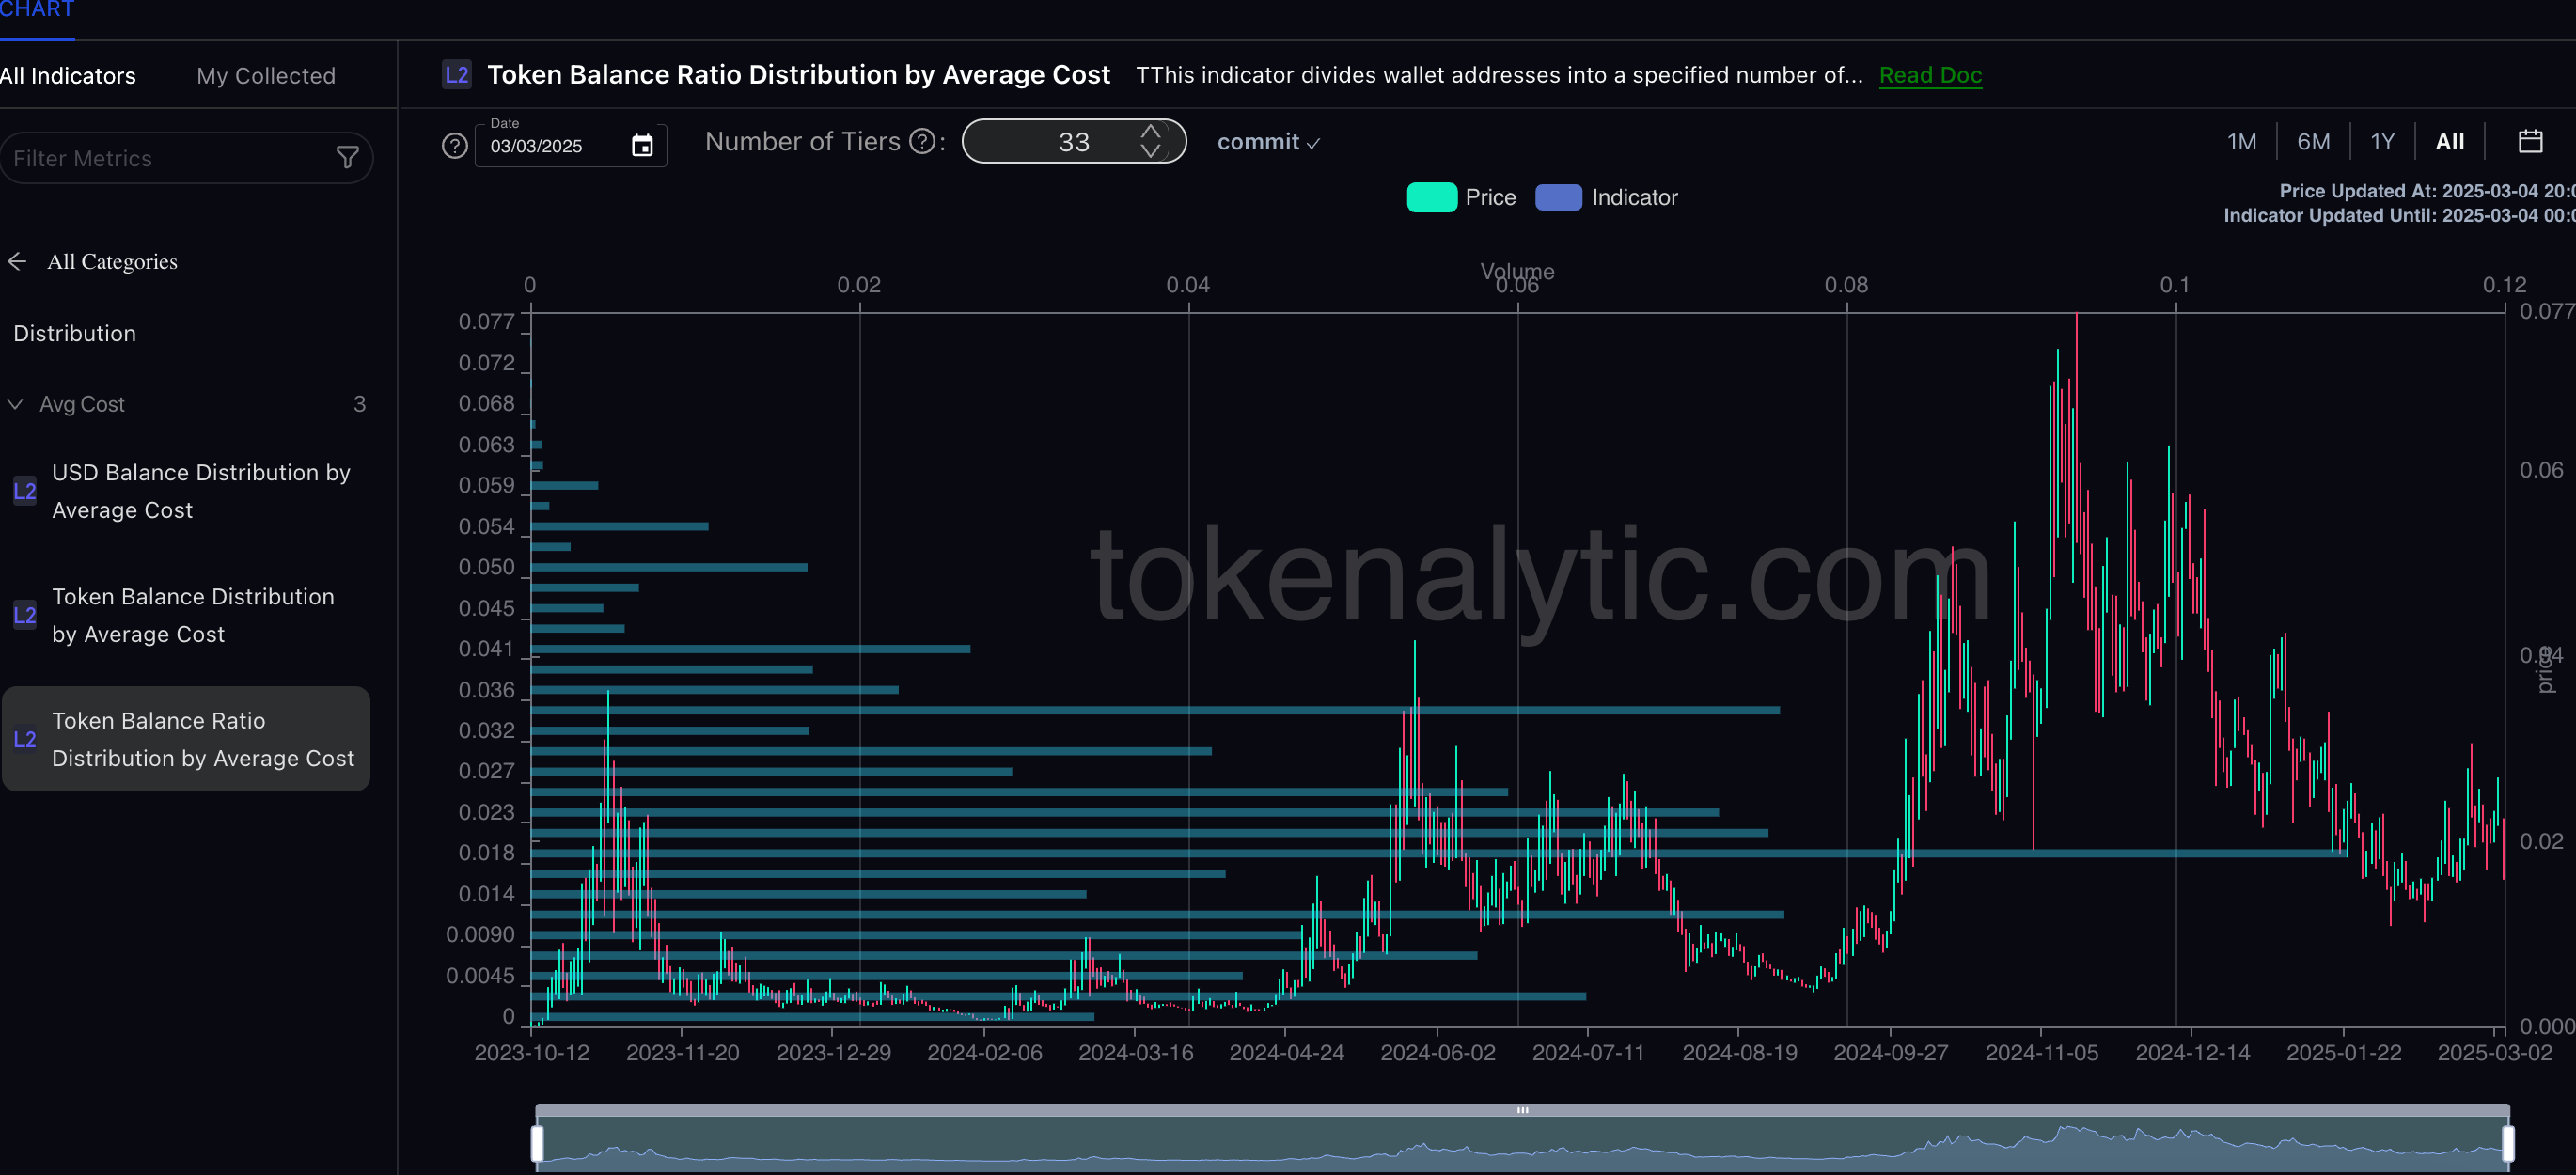
Now, let's change the time and tier parameters to see how the results differ:
K-line time range setection
Select the time range for displaying the K-line chart and indicators. The default is 1 Year, while paid users can access the full historical data.
Indicator Update Information
This section displays when the K-line and indicator data were last updated. For K-line charts and most indicators, we update hourly. For certain indicators like average cost-related and token day-related metrics, data is typically updated every 24 hours.